Vancouver, British Columbia – Ero Copper Corp. (the “Company”) (TSX: ERO) is pleased to announce the release of its 2019 updated National Instrument 43-101 Standards of Disclosure for Mineral Projects (“NI 43-101”) compliant mineral reserve and resource estimate along with updated life of mine (“LOM”) production, capital and operating cost projections for a flexible and phased plan to return the Caraíba Mill to its original design capacity of 5.5 million tonnes per annum on its 99.6% owned Vale do Curaçá Property (herein referred to as the “Curaçá Valley”) located in Bahia State, Brazil. Highlights of the 2019 mineral reserve and resource estimate include:
- A 106% increase in Proven and Probable mineral reserves to approximately 38 million tonnes (containing 436,000 tonnes of copper) compared to the Proven and Probable mineral reserves set out in the 2018 Technical Report (as defined below), using the same copper price assumption of US$2.75 per pound;
- A 69% increase in Measured and Indicated mineral resources to approximately 72 million tonnes (containing approximately 894,000 tonnes of copper), inclusive of mineral reserves, as compared to the Measured and Indicated mineral resources set out in the 2018 Technical Report at the same geological cut-off grades;
- Updated LOM production plan increasing copper production by approximately 140,000 tonnes of copper as compared to the LOM production plan set out in the 2018 Technical Report;
- Pathway provided for a low-cost and phased mill expansion to return the mill to its original design capacity of 5.5 million tonnes per annum with a preliminary capital expenditure estimate of US$63 million.
Commenting on the update, David Strang, President and CEO stated, “We are very pleased with the 2019 updated mineral resource and reserve estimate. Since acquiring the operations in the Curaçá Valley in 2016, we have continued to significantly grow mineral resources and reserves annually. Including mine depletion, we have added over 500,000 tonnes of contained copper to our measured and indicated resource base since 2017. In addition, our updated LOM plan continues to increase the copper production profile over the prior year. In 2018, we set out a plan to produce approximately 40,000 tonnes of copper annually for the following six years and in 2019, that plan has increased to approximately 50,000 tonnes of copper.
As we look to the future, and to support our continued growth, our exploration focus is moving towards delineating new, higher grade mineral resources and reserves away from our existing operations and portfolio of inherited projects. In order to support this strategy, we will be taking a phased approach to investing capital in the Caraíba Mill to systematically return it to its original design capacity of 5.5 million tonnes per annum, per prevailing copper prices and continued exploration success. At the same time, we are evaluating the opportunity afforded by ore sorting, which has the potential to increase mill head grades at reduced mill throughput given the heterogenous nature of our deposits.
This is a very exciting, but busy, time for Ero Copper as our focus changes from mainly in- and near-mine growth towards growth from discovery of new mineral resources in the Curaçá Valley, such as Siriema, and with the additional value enhancing opportunities such as the phased expansion of the mill and ore sorting. In summary, we have increased the number of options available to continue to execute on our core objective of generating strong absolute returns on invested capital for our shareholders in an uncertain macroeconomic environment.”
The 2019 updated mineral reserve and resource estimate is shown in the tables below: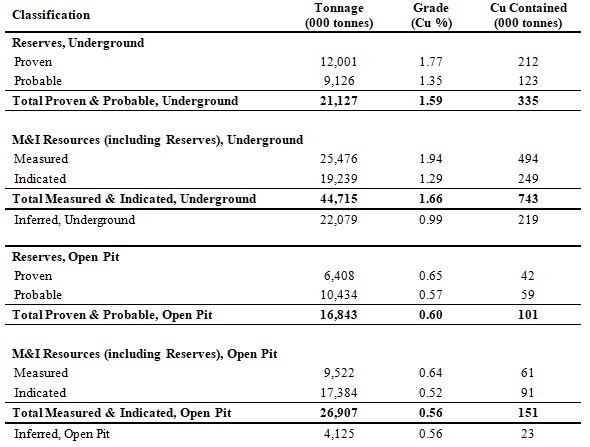
Mineral Reserve & Resource Notes:
- Mineral reserve effective date of September 18, 2019.
- Mineral resource effective date varies by deposit, with an effective date of July 9, 2019, except for Vermelhos N8/N9 (July 31, 2019) and Baraúna and Siriema (September 15, 2019).
- Presented mineral resources inclusive of mineral reserves. All figures have been rounded to the relative accuracy of the estimates. Summed amounts may not add due to rounding.
- Mineral resources have been modeled within a 0.20% copper grade shell using a 0.68% copper cut-off grade for underground deposits and a 0.18% copper cut-off grade for open pit deposits. Mineral resources have been estimated using ordinary kriging inside 5m by 5m by 5m block sizes. The mineral resource estimates were prepared in accordance with the Canadian Institute of Mining, Metallurgy and Petroleum (“CIM”) Definition Standards for Mineral Resources and Mineral Reserves, adopted by the CIM Council on May 10, 2014 (the “CIM Standards”), and the CIM Estimation of Mineral Resources and Mineral Reserves Best Practice Guidelines, adopted by CIM Council on November 23, 2003 (the “CIM Guidelines”), using geostatistical and/or classical methods, plus economic and mining parameters appropriate to the deposit. Please see “Technical and Scientific Information” below for additional information on the stated mineral resources.
- Mineral reserve estimates were prepared in accordance with the CIM Standards and the CIM Guidelines, using geostatistical and/or classical methods, plus economic and mining parameters appropriate for the deposit. Mineral reserves are based on a long-term copper price of US$2.75 per pound (“lb”), and a USD:BRL foreign exchange rate of 3.70. Mineral reserves are the economic portion of the Measured and Indicated mineral resources. Mining dilution and recovery factors vary for specific mineral reserve sources and are influenced by factors such as deposit type, deposit shape, stope orientation and selected mining method. Inferred resource blocks, where unavoidably mined, were assigned zero grade. Dilution occurring from Measured & Indicated resource blocks was assigned grade based upon the current mineral resource grade of the blocks included in the dilution envelope. Please see “Technical and Scientific Information” for additional information on the stated mineral reserves.
Mineral resources which are not mineral reserves do not have demonstrated economic viability.
UPDATED PRODUCTION PLAN
The Company’s updated production plan, prepared in conjunction with the mineral resource and mineral reserve update, provides a road map for a low-cost, flexible and phased approach to return the Caraíba Mill to its original design capacity of 5.5 million tonnes per annum, with a timeline and three-year capital outlay that can be paired alongside continued exploration success and prevailing copper prices. This plan will allow the Company to capitalize on future discoveries within the Curaçá Valley as they are drilled and developed.
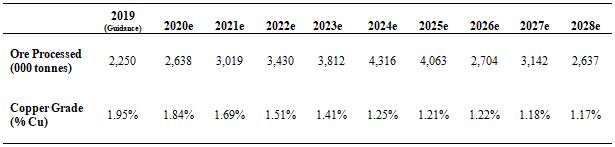
The table below outlines the updated production plan for the Curaçá Valley. The plan is centered upon increasing plant capacity and throughput to 5.5 million tonnes of capacity with a three-year phased capital plan, resulting in production of approximately 48,000 tonnes of copper in concentrate per annum, on average, over the next 6 years based on current reserves.
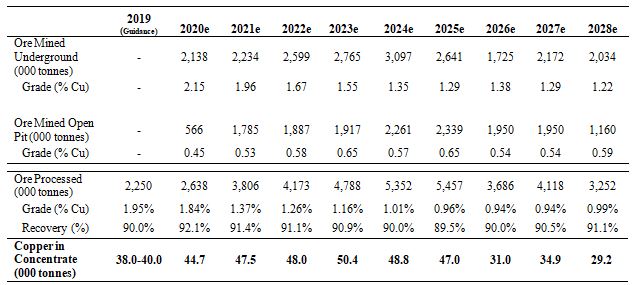
Please refer to the Company’s press release dated August 8, 2019 for complete 2019 revised guidance information. Processed tonnes may not sum mined totals due to intermediate mine stockpiles.
UPDATED OPERATING & CAPITAL COSTS
The updated production plan has resulted in changes to the forecast operating and capital cost estimates. The tables below show the operating and capital costs for the updated production schedule.
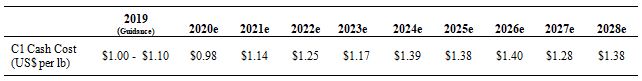
C1 Cash Cost Notes:
- Assumes USD:BRL FX rate of 3.80.
- Assumes gold price of US$1,400 per ounce and silver price of US$17.00 per ounce.
- C1 Cash Cost of copper produced is a non-IFRS measure, as more particularly discussed under the “Technical and Scientific Information” section of this press release.
- Please refer to the Company’s press release dated August 8, 2019 for complete guidance information.
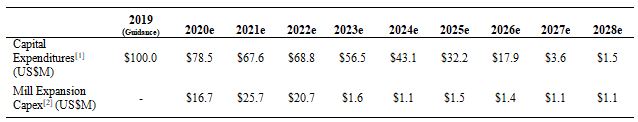
Capital Expenditure Notes:
- Excluding mill expansion capital
- Preliminary mill expansion capital plan shown estimated based on +/- 30% accuracy, pending completion of detailed engineering and integration costing.
- Assumes USD:BRL FX rate of 3.80.
- Please refer to the Company’s press release dated August 8, 2019 for complete guidance information.
- Capital expenditures shown do not include discretionary greenfield or brownfield exploration in years 2020 to 2028.
MINERAL RESOURCE GROWTH
The following section discusses the updated mineral reserve and resource estimates as they relate to each of the three mineral districts of the Curaçá Valley. Detailed information with respect to tonnes, grade and contained copper for the mineral reserve and resource estimates for each mineral district can be found at the end of this press release. Relative comparisons of 2019 to 2018 refer to the 2019 updated mineral resource and reserve estimate discussed herein and the 2018 Technical Report, respectively. A more fulsome discussion of the installed infrastructure within each of the mineral districts of the Curaçá Valley can be found in the 2018 Technical Report.
Vermelhos District
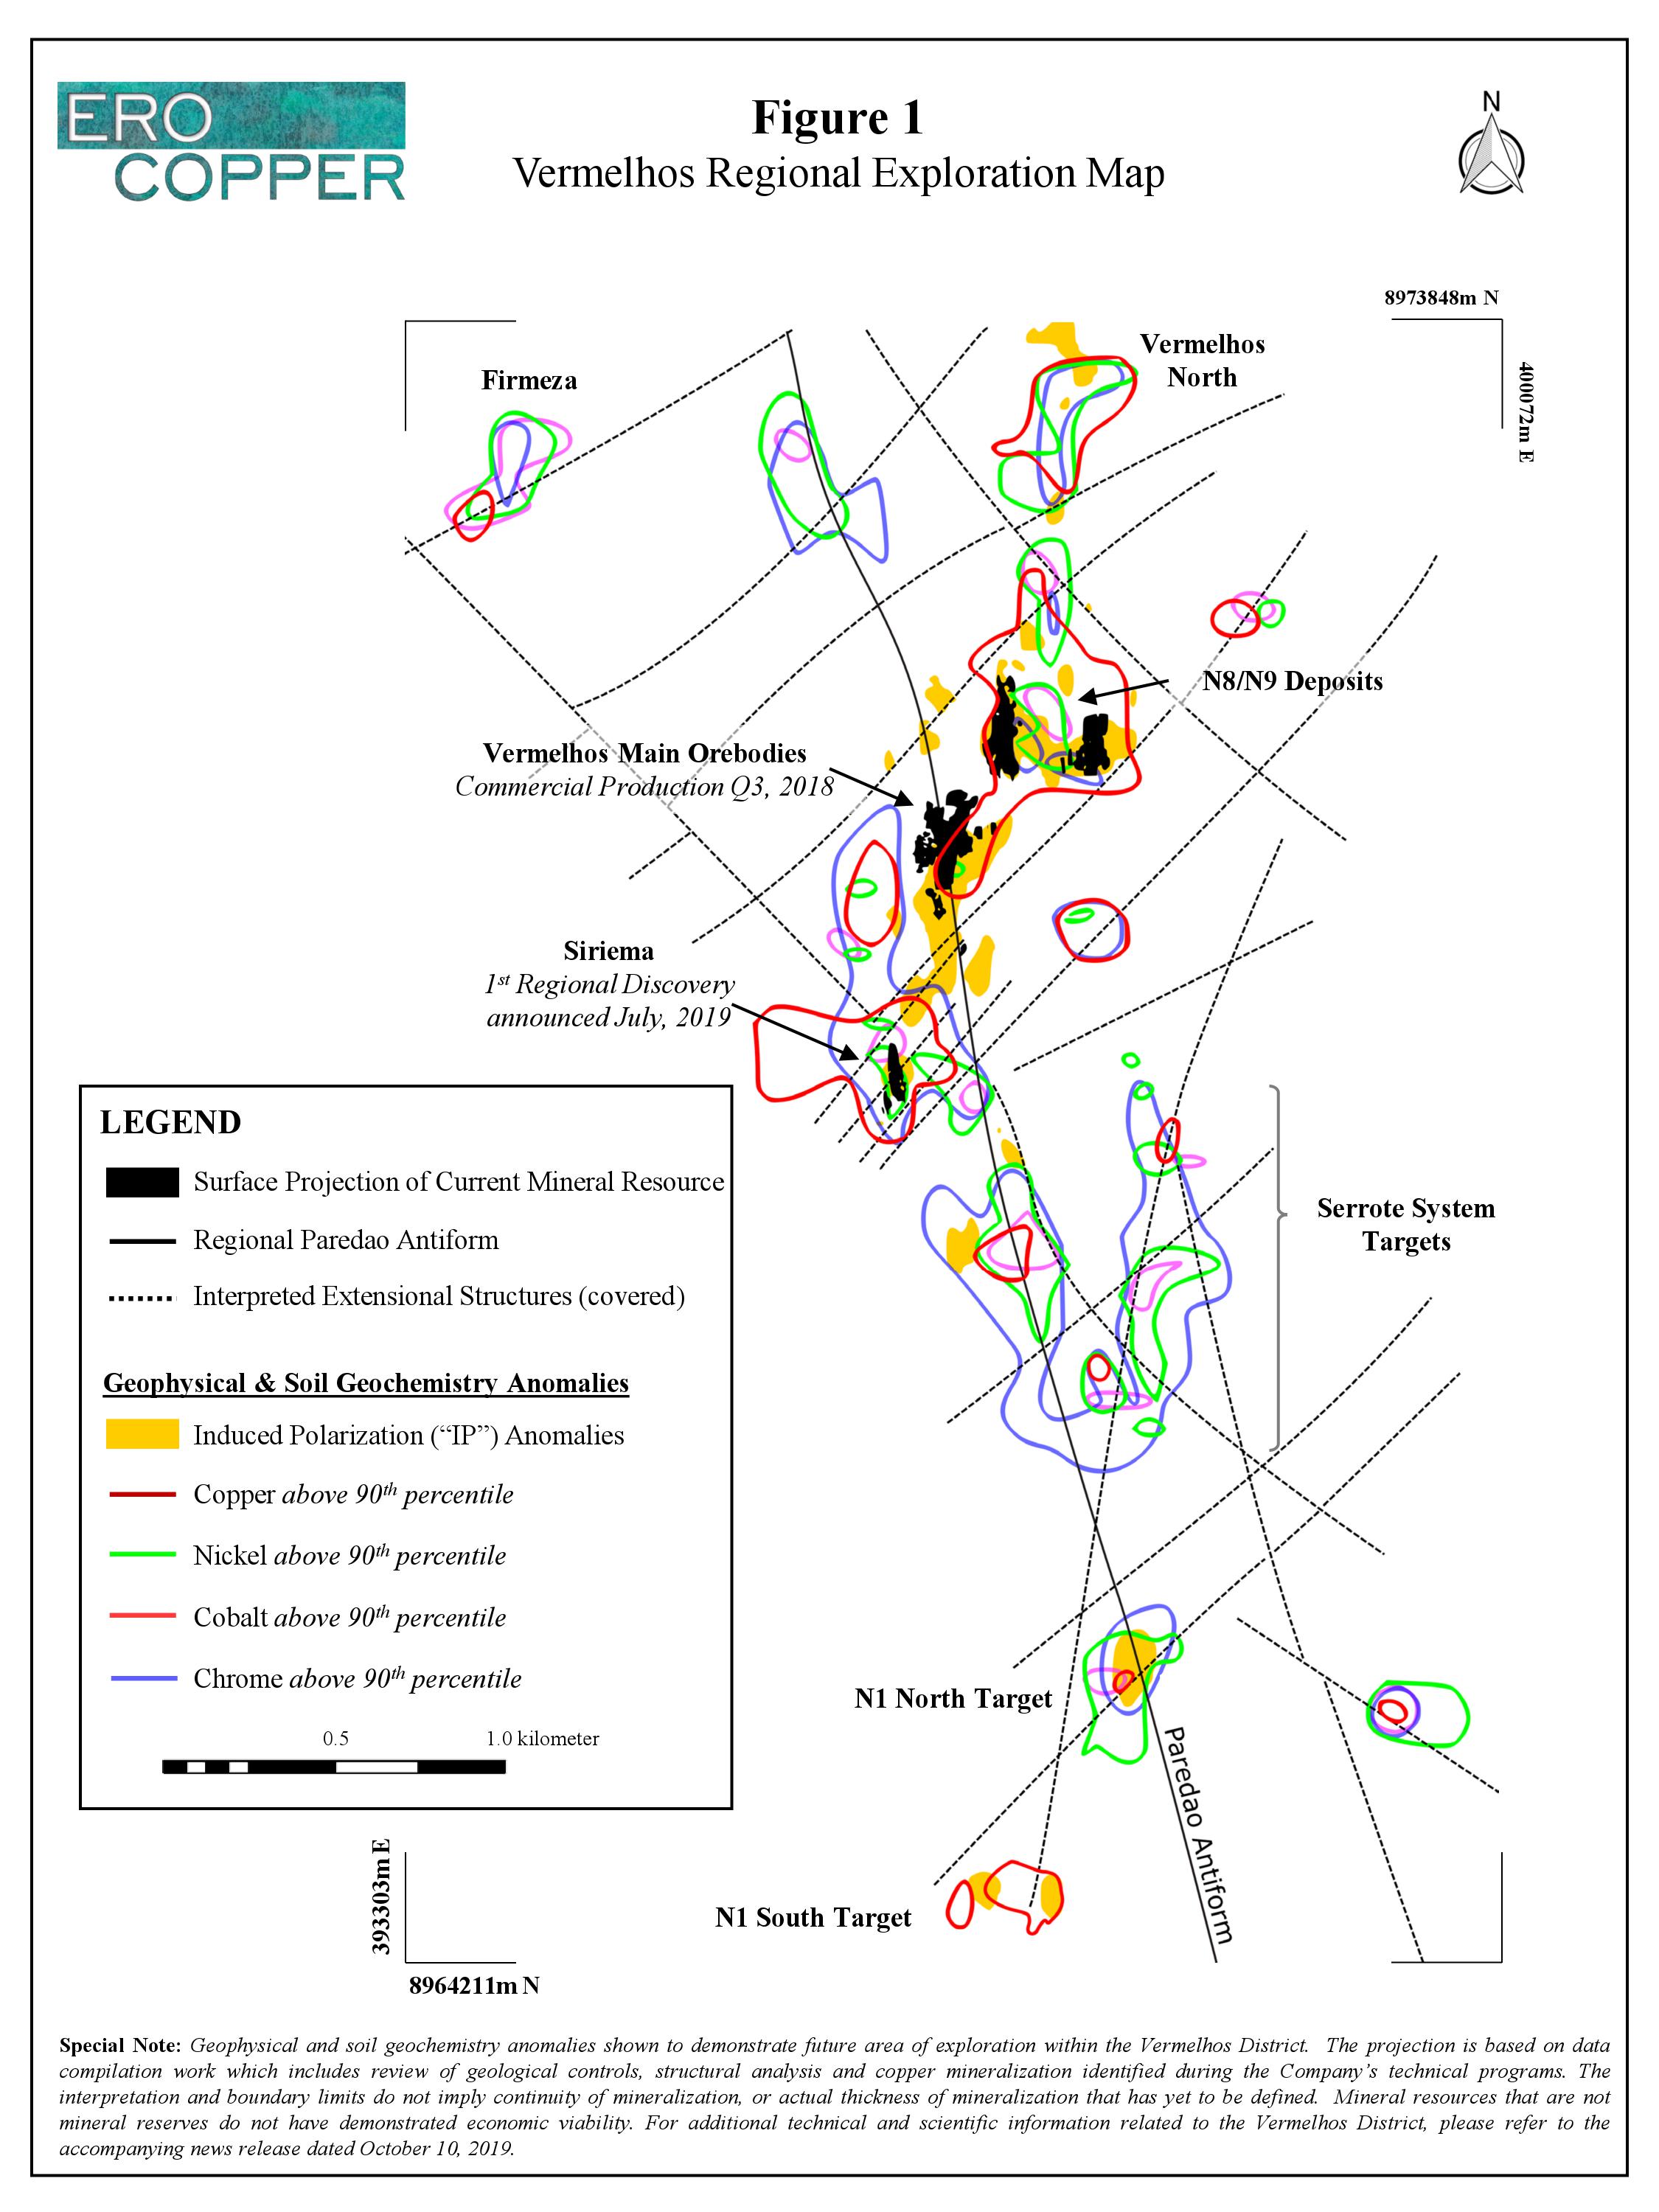
The Vermelhos District encompasses the Vermelhos underground mine, the N8/N9 open pit deposit and the recently announced Siriema discovery, which is currently envisioned as an open pit mine. The Company commenced construction of the Vermelhos mine during the second quarter of 2017, and declared commercial production during the third quarter of 2018, approximately 16 months after construction began and approximately 4 months ahead of schedule. Ore mined from the Vermelhos District is hauled to the Caraíba Mill, located approximately 80 kilometers south of Vermelhos, via the Curaça Valley haul road.
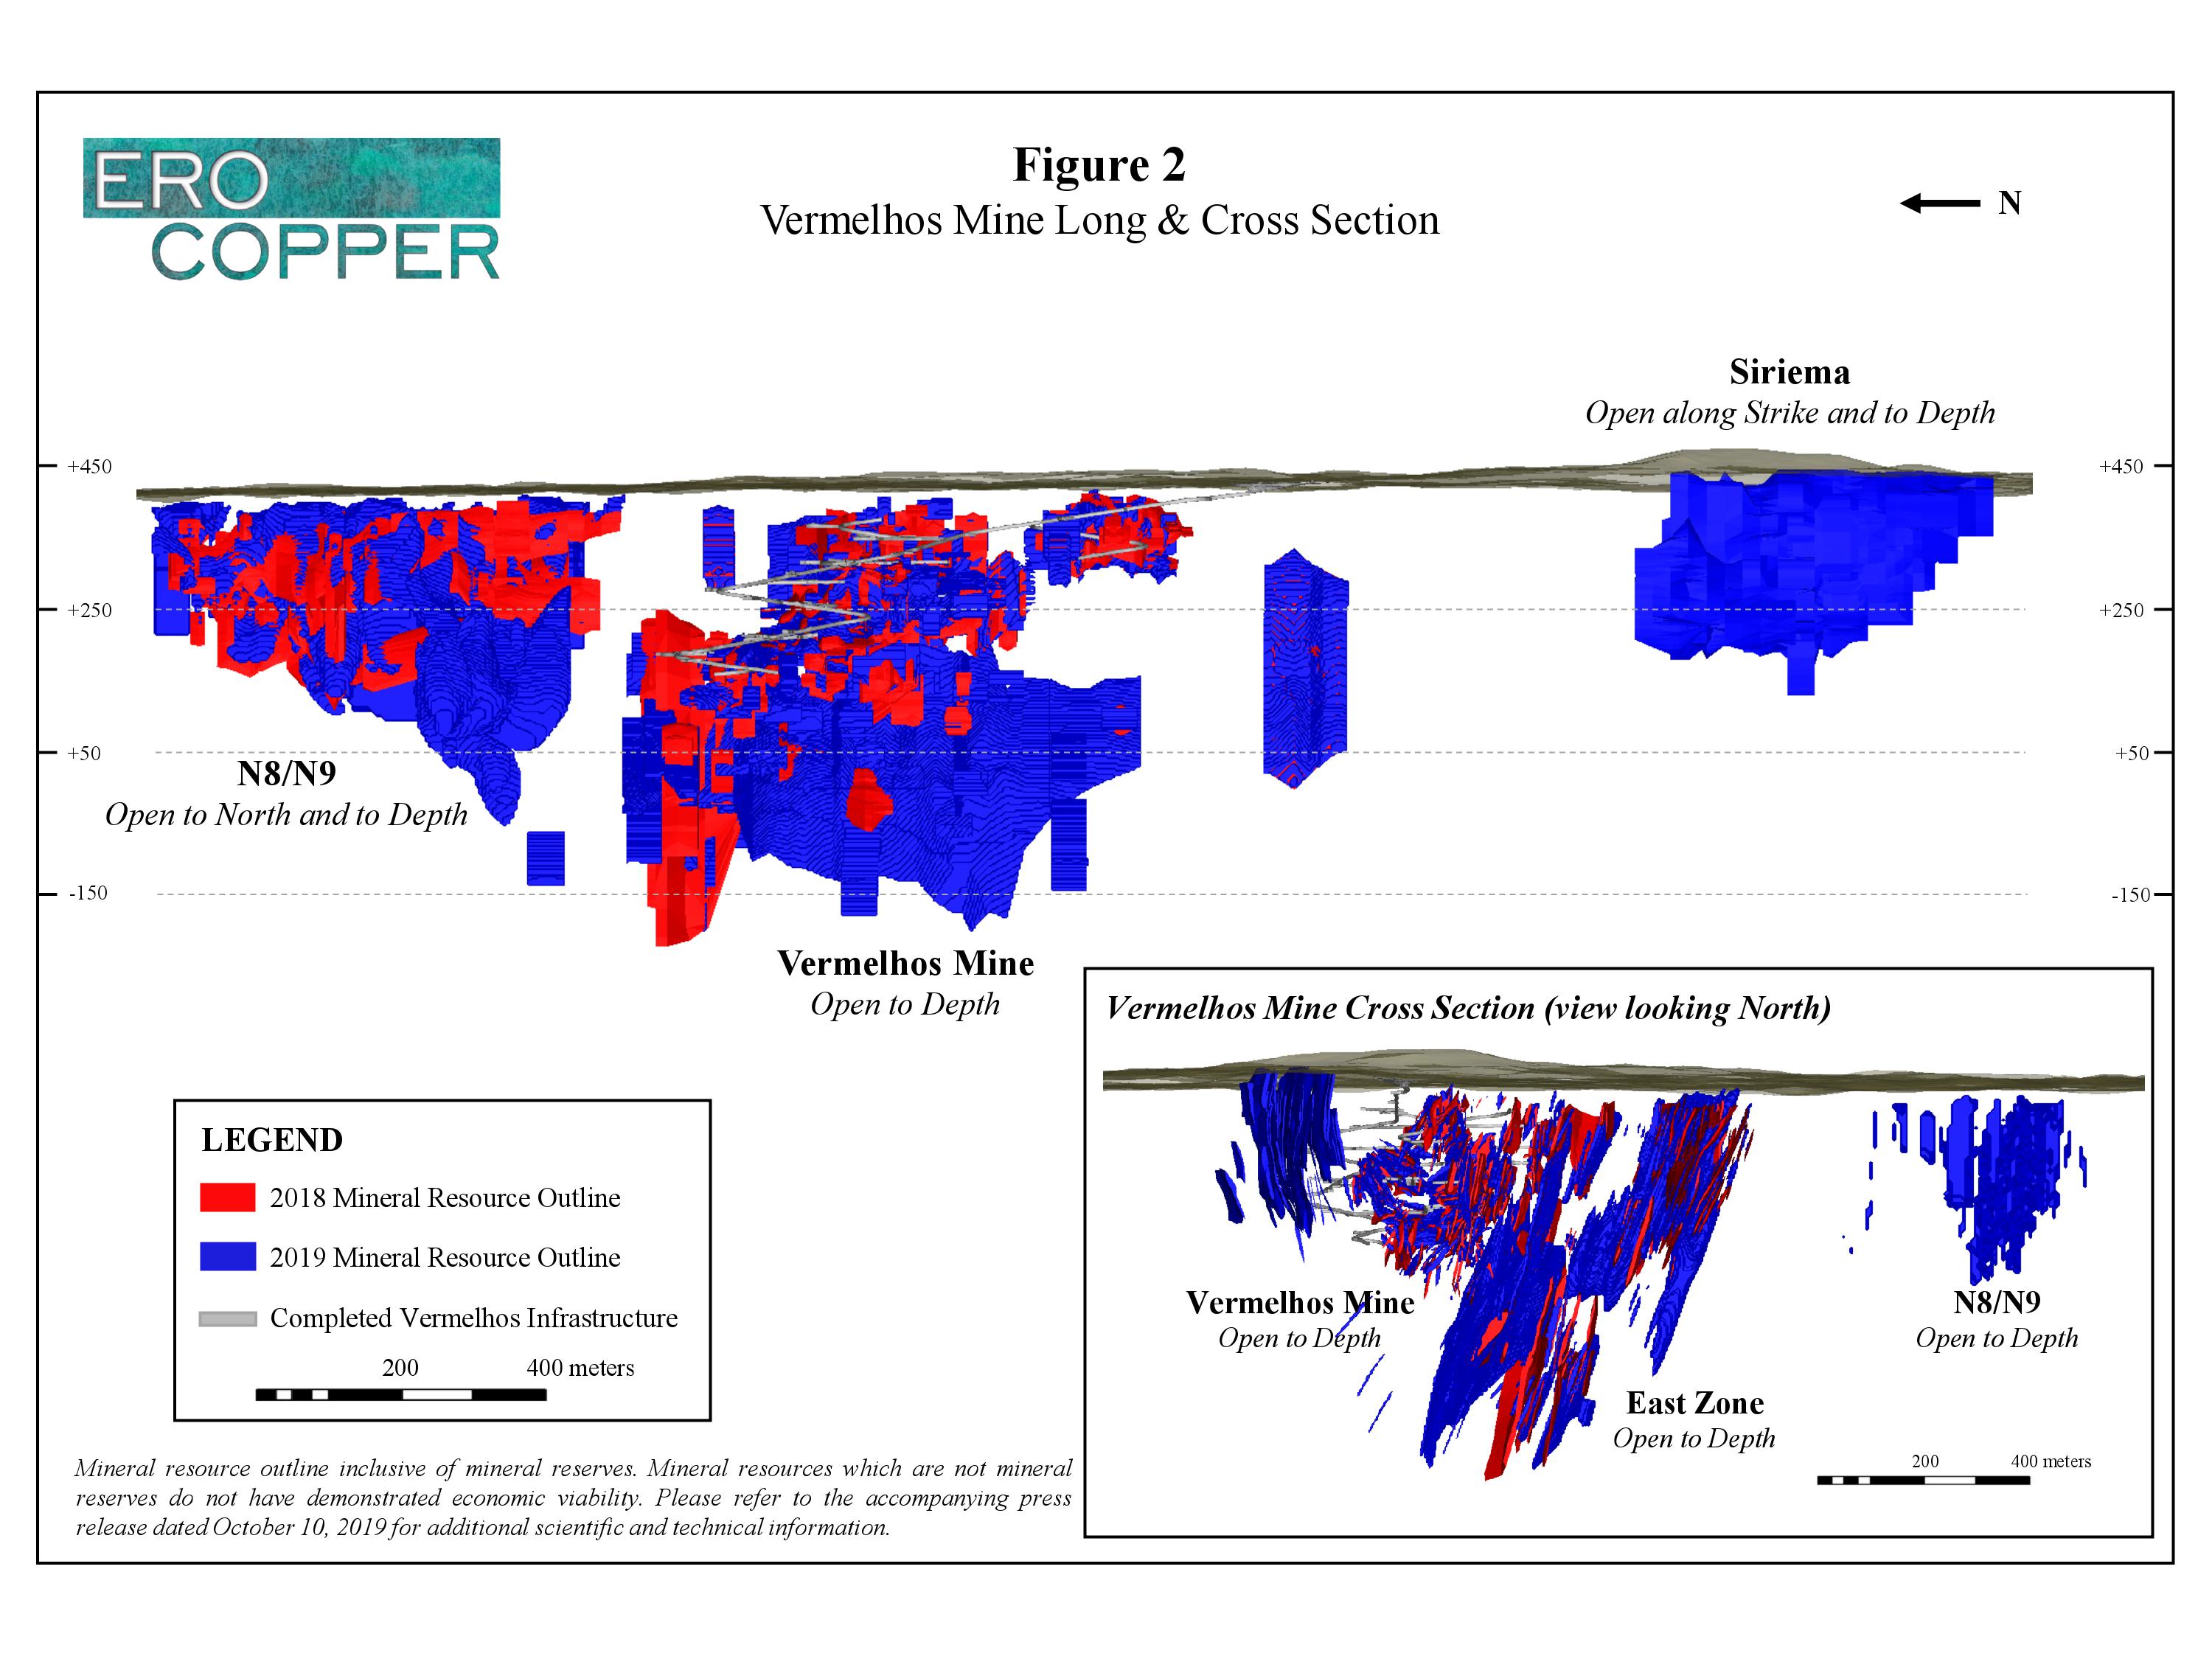
Contained copper within the Measured and Indicated mineral resource increased by 23% in the Vermelhos District. This increase, on a contained copper basis, was primarily attributable to significant increases at the N8/N9 open pit deposit and Siriema, which more than off-set depletion at the Vermelhos Mine, for a total net increase of approximately 46,000 tonnes of contained copper (Vermelhos District total of approximately 250,000 tonnes in 2019 vs. 204,000 tonnes in 2018). Approximately 37,000 tonnes and 16,000 tonnes, respectively are attributable to N8/N9 and Siriema. At the Vermelhos underground mine, approximately 630,000 tonnes of ore was mined grading 3.00% copper prior to the July 9, 2019 effective date of the 2019 updated mineral resource and reserve estimate. Despite this depletion of approximately 19,000 tonnes of contained copper, the updated Measured and Indicated mineral resource of the mine only resulted in a net decline of 6,000 tonnes of contained copper due to off-setting increases, primarily from the Vermelhos East Zone extension to depth.
During the fourth quarter, near-mine exploration drilling will continue to focus on the recently announced Siriema discovery, where drilling continues to highlight a shallow-plunging east-dipping zone of high-grade massive sulphide breccia mineralization. This zone was highlighted recently by drill hole FSI-42 that intersected 31.8 meters grading 2.22% copper including 5.0 meters grading 5.56% copper. In addition, follow-up drilling from underground drill-stations will target a newly identified zone of high-grade mineralization approximately 70 meters below the main Vermelhos orebodies, as highlighted by hole FVS-465 that intersected 13.4 meters grading 5.86% copper including 8.4 meters grading 7.04% copper (please refer to the Company’s press releases dated June 20, 2019 and September 12, 2019 for complete Vermelhos mine and Siriema drill results).
Regional greenfield drilling within the Vermelhos District is currently targeting several high-priority exploration targets identified during the Company’s comprehensive targeting work. These targets extend over approximately 10 kilometers of anomalous soil geochemistry and induced polarization (“IP”) anomalies along the Paredao Antiform as shown in Figure 1. A long-section and cross-section of the Vermelhos mine, including Siriema and N8/N9 mineral resources are shown in Figure 2.
Pilar District
The Pilar District encompasses the Pilar underground mine (which includes the zones of: Baraúna, the Deepening, East Limb, MSB South, the West Limb, P1P2 W, R22 and P1P2 West) as well as the open pit deposits of R75, and Suçuarana. With the exception of a brief period in 2016, mining within the Pilar District has been continuous since 1979. The Pilar District includes the Caraíba Mill, which currently receives and processes ore mined by the Company from deposits throughout the Curaçá Valley including those within the Vermelhos and Surubim Districts.
Contained copper within the Measured and Indicated mineral resource category increased by 19% in the Pilar District. This increase in contained copper was primarily attributable to a significant 74,000 tonne increase in the Pilar underground mine (total of approximately 546,000 tonnes contained copper in 2019 vs. 472,000 tonnes in 2018), as well as 16,000 tonnes of contained copper combined between the R75 and Suçuarana open pit deposits.
During the fourth quarter, infill and extensional drilling in the Pilar underground mine will continue to focus on high-grade zones that the Company has yet to fully delineate. These include recent drill results from the Deepening zone, located down-plunge to the north and along strike to the south of known mineralization. Recent drill results in the Deepening are highlighted by drill hole FC47142 that intersected 34.7 meters grading 2.29% copper including 18.6 meters grading 3.15% copper and hole FC47139 that intersected 23.3 meters including 3.68% copper.
In addition to the Deepening zone, drilling during the fourth quarter at Pilar will seek to further delineate the area surrounding recent results in the South Extension zone located at higher levels of the mine south of the planned mining blocks of MSB South. Drilling in the South Extension from a new exploration drift located on level -300 is highlighted by hole FC34100 that intersected 25.5 meters grading 1.47% copper including 2.0 meters grading 5.85% copper (please refer to the Company’s press release dated September 12, 2019 for complete Deepening and South Extension results). A long-section and cross-section of the Pilar underground mine are shown in Figure 3.
Surubim District
The Surubim District encompasses the Surubim underground mine, a neighboring deposit to the south known as C12, currently envisioned as an open pit mine, and several historic previously known resources that have been validated for the purposes of the 2019 updated mineral resource reserve estimate. These historic projects include: Cercado Velho, Lagoa da Mina and Terra do Sal, which are located in the vicinity of the Surubim mine. The open pit portion of the Surubim mine was mined by the Company from the first quarter of 2018 to the first quarter of 2019.
Contained copper within the Measured and Indicated mineral resource estimate increased by 69% in the Surubim District (approximately 82,000 tonnes in 2019 vs. 49,000 tonnes in 2018). This increase in contained copper is attributable to the historic validated deposits which collectively added approximately 16,000 tonnes of contained copper in 2019 with Cercado Velo, Lagoa da Mina Terra do Sal each contributing approximately 3,100 tonnes, 10,600 tonnes and 1,800 tonnes of contained copper, respectively. In addition, the contribution from the C12 deposit is approximately 32,000 tonnes. Offsetting these gains, approximately 12,000 tonnes of contained copper was mined from the Surubim open pit mine prior to the July 9, 2019 effective date of the 2019 updated mineral resource and reserve estimate, resulting in a net gain of approximately 34,000 tonnes of contained copper.
Near-mine and regional greenfield exploration drilling is primarily focused on the Pilar and Vermelhos Districts for the balance of 2019. A long-section of the Surubim mine is shown in Figure 4.
REGIONAL EXPLORATION PROGRAM UPDATE
With the completion of the 2019 updated mineral resource and reserve estimate, the Company has shifted its exploration focus from in- and near-mine exploration (including infill, upgrade, validation and extensional programs) to regional greenfield exploration. The Company has, and will continue to increase the ratio of regional greenfield exploration to in- and near-mine exploration. In 2018, only 4% of all drilling completed during the year was allocated to regional greenfield exploration. Through the end of the third-quarter, 2019 this ratio increased to approximately 17%, and during the fourth quarter of 2019 approximately 50% of total meters drilled are expected to be allocated to regional greenfield exploration. Subject to continued exploration success, the Company expects to allocate approximately 60% of its 2020 exploration program effort to regional greenfield targets throughout the Curaçá Valley.
TECHNICAL AND SCIENTIFIC INFORMATION
Mineral Resources
Block model tonnage and grade estimates for the Curaçá Valley were classified according to the CIM Standards and the CIM Guidelines by Sr. Porfirio Cabaleiro Rodriguez of GE21 Consultoria Mineral Ltda. (“GE21”) who is an independent qualified person as such term is defined under NI 43-101.
Cut-off grades of 0.68% copper were used for underground (“UG”) mineral resources and 0.18% for open pit (“OP”) mineral resources based on copper prices of $3.00 per lb., net smelter return (“NSR”) of 87.5%, metallurgical recoveries of 87.5%, processing costs of US$5.70 per tonne (run of mine, including transport) and mining costs of US$3.30 and US$28.60 per tonne for open pit and underground deposits, respectively. Mineral resources were estimated using ordinary kriging within 5m by 5m by 5m block sizes. Mineral resources associated with underground deposits were constrained using a minimum stope dimension of 5m by 2.5m by 5m. Mineral resources associated with open-pit operations were limited using a Whittle 3D pit (LG 3D). Mineral resources are shown inclusive of mineral reserves.
Mineral Resource effective date of July 9, 2019 for all deposits with the exception of the N8/N9 deposits of the Vermelhos District, which have an effective date of July 31, 2019, and Baraúna (Pilar District) and Siriema (Vermelhos District) both of which have an effective date of September 15, 2019.
Mineral Reserves
The mineral reserves for the Pilar, Vermelhos, and Surubim Districts are derived from the Measured and Indicated mineral resources as defined within the resource block models following the application of economic and other modifying factors further described below. Inferred mineral resources, where unavoidably mined within a defined mining shape have been assigned zero grade. Dilution occurring from Measured & Indicated resource blocks was assigned grade based upon the current mineral resource grade of the blocks included in the dilution envelope. Mineral reserves were classified according to the CIM Standards and the CIM Guidelines by Rubens Jose De Mendonça of Planminas – Projectos e Consultoria em Mineração Ltd., an independent qualified person as such term is defined under NI 43-101.
Mineral reserve cost assumptions are based on actual operating cost data during the 18-month period from January 1, 2018 to June 30, 2019. The USD:BRL rate of 3.70 was selected based on the average rate during this same period.
A summary of the mineral reserve estimate parameters is provided below:
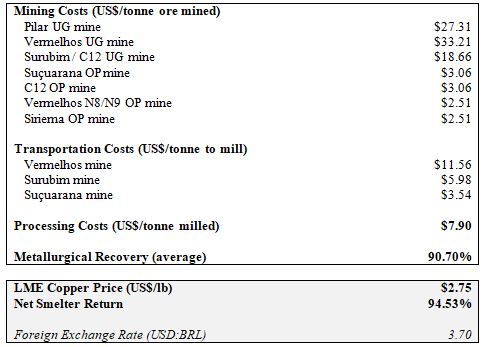
Reserve Parameters Note
All road-maintenance costs associated with the Curaçá Valley haul road have been allocated to Vermelhos. Calculated difference between Suçuarana OP mine / C12 OP mine and Vermelhos N8/N9 / Siriema open pit mining costs are a result of additional incurred costs related to contract mining envisioned for Suçuarana and C12. Metallurgical recoveries vary by area. Average estimated metallurgical recoveries of 91.0% used for Pilar underground mine, 92.0% for Vermelhos underground mine, 89.0% for the Surubim / C12 underground mines, and 89.0% for each of the open pit deposits of C12, Suçuarana, N8/N9 and Siriema.
Other modifying factors considered in the determination of the mineral reserve estimate include:
- Maximum bench height of 10m for open pit mines. Maximum underground stope dimensions based on geotechnical assessments from previous studies and past operating experience within each mining area, combined with evaluation of induced stresses and the Rock Mass Rating (“RMR”).
- The Vertical Retreat Mining (“VRM”) method with cemented paste fill was selected for the Pilar UG Mine, where the method is currently in use. For the Vermelhos UG Mine, Sublevel Open Stoping method (“SOS”) is the mining method currently in use on consideration of the dip, plunge and thickness of the ore-bodies, the rock quality designation (“RQD”) and overall competence of the host rock. Variations of this method are in use within the central high-grade area for the maximum possible recovery via cemented rockfill matrix filling (“CRF”).
- Within designed stopes, all contained material was assumed to be mined with no selectivity. Inferred mineral resources, where unavoidably included within a defined mining shape have been included in the mineral reserves estimate at zero grade. Mining dilution resulting from Measured and Indicated blocks was assigned the grade of those blocks captured in the dilution envelope using the current mineral resource estimate.
- Dilution and mining recovery values vary by deposit as set forth below:
- Pilar UG mine operational dilution of 12%, mining recovery of 96%.
- Vermelhos UG mine operational dilution of 10%, mining recovery of 100%.
- Vermelhos N8/N9 overall dilution of 10%, mining recovery of 100%.
- Siriema overall dilution of 10%, mining recovery of 100%.
- Suçuarana OP operational dilution of 10%, mining recovery of 100%
- Surubim/C12 UG operational dilution of 10%, mining recovery of 100%.
Ore-Sorting & Modeled Impacts to Mill Feed
As part of its ongoing optimization efforts, and in recognition of the heterogeneous nature of the mineralization of the Curaçá Valley, the Company undertook testwork in early 2019 to evaluate the potential of Rados XRF ore-sorting to upgrade copper content of mined ores. In order to evaluate this potential, three bulk samples weighing approximately 300kg each, 900kg in total, were collected from several locations within the Surubim mine. The sampling program sought to create representative high-grade, medium-grade and waste bulk composite sample from exposed ore in a recently mined open pit to form approximately one tonne of material grading approximately one percent copper. These samples were crushed, screened and delivered to Metanza Mineral Processors (Pty) Ltd. outside of Johannesburg South Africa in six drums. Particle sizes of the bulk samples ranged between 30mm and 75mm.
These samples were passed through a Rados XRF machine in normal operation mode to analyze the particles as they fell past the Rados XRF sensor, which was set to record the relative values of copper, iron, nickel and calcium. Relative values were normalized to develop optimal sorting conditions based on the normalized values of copper, nickel and iron. A 24 product factoral approach was then used to evaluate the cumulative performance throughout the selectivity range for each composite sample. Each of the sort products were pulverized and sent to ALS laboratories in Johannesburg to determine copper, nickel, iron and calcium contents using four-acid digestion and inductively coupled plasma atomic emission spectroscopy (“ICP-AES”). ALS laboratories is independent of the Company.
The results of this test program demonstrated that Rados XRF ore-sorting could be used to upgrade the copper content of these samples with minimal copper loss. The combined result showed that a sample weighing approximately 900kg and grading 1.00% copper could be sorted to approximately one-half of its original mass, while only losing 5% of the contained copper. The results of the testwork program are shown below for the Rados XRF selectivity setting that maximized copper recovery.
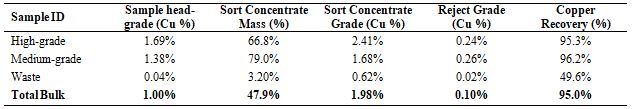
Total Bulk sample mass of 912.9kg comprised of 292.3kg of high-grade, 292.9kg of medium-grade and 327.7kg of waste sample. Cumulative performance up to the selectivity range for maximum copper recoveries shown.
While preliminary, the results of this testing program were modeled for each of the open pit deposits within the Company’s production portfolio to illustrate the potential impact of ore-sorting on the life of mine mill feed. Each open pit deposit’s ore-sorting performance was modeled using the required composition of high-grade, medium-grade and waste sample to meet the tonnage and grade of each deposit’s Proven and Probable mineral reserves. The simulated performance was checked against the test program data to ensure that modeled sorting performance of each deposit matched the empirical test results. The result for modeled mill feed with the implementation of ore sorting on open pit production, commencing in 2021, is as follows:
Ore-sorting assumed to commence in 2021. The effects of stockpiling were not considered. 32% of crushed open pit feed assumed to be fines generated from mining, hauling and crushing and therefore not amenable to upgrading.
A 200,000 tonne per annum plant is expected to arrive on site during the fourth quarter to further validate laboratory results.
Detailed Mineral Resource and Reserve Tables
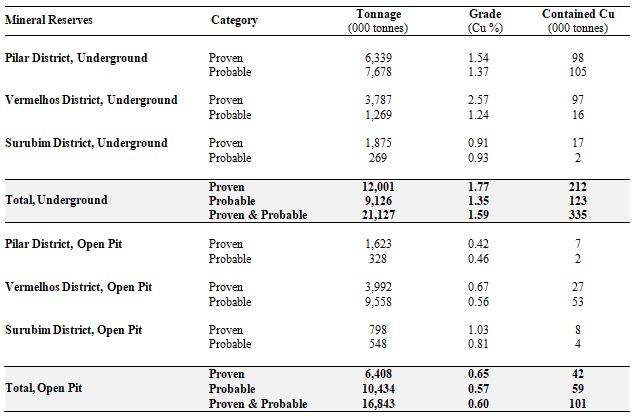
Mineral Reserve Notes
- Mineral reserve effective date of September 18, 2019.
- All figures have been rounded to the relative accuracy of the estimates. Summed amounts may not add due to rounding.
- Mineral reserve estimates were prepared in accordance with the CIM Standards and the CIM Guidelines, using geostatistical and/or classical methods, plus economic and mining parameters appropriate for the deposit. Mineral reserves are based on a long-term copper price of US$2.75/lb, and a USD:BRL foreign exchange rate of 3.70. Mineral reserves are the economic portion of the Measured and Indicated mineral resources. Mining dilution and recovery factors vary for specific mineral reserve sources and are influenced by factors such as deposit type, deposit shape, stope orientation and selected mining method. Inferred resource blocks, where unavoidably included, were assigned zero grade. Dilution occurring from Measured & Indicated resource blocks was assigned grade based upon the current mineral resource grade of the blocks included in the dilution envelope. Please see “Technical and Scientific Information” above for additional information on the stated mineral reserves.
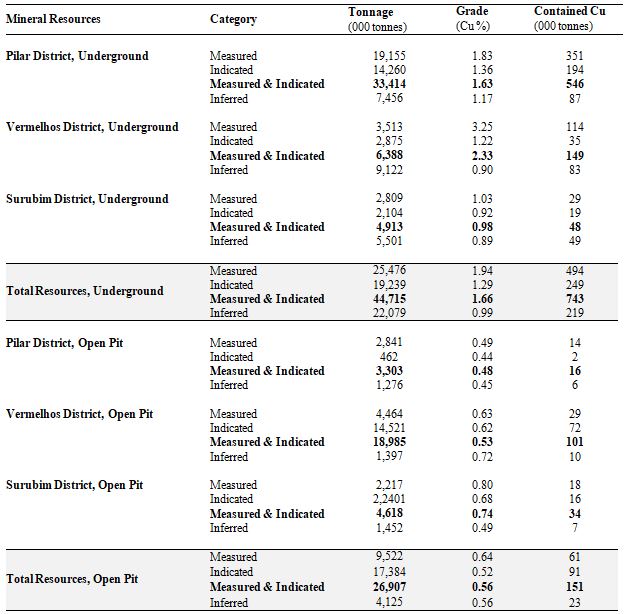
Mineral Resource Notes
- Mineral resource effective date varies by deposit, with an effective date of July 9, 2019, except for Vermelhos N8/N9 (July 31, 2019) and Baraúna and Siriema (September 15, 2019).
- Presented mineral resources inclusive of mineral reserves. All figures have been rounded to the relative accuracy of the estimates. Summed amounts may not add due to rounding. Mineral resources which are not mineral reserves do not have demonstrated economic viability.
- Mineral resources have been modeled within a 0.20% copper grade shell using a 0.68% copper cut-off grade for underground deposits and a 0.18% copper cut-off grade for open pit deposits. Mineral resources have been estimated using ordinary kriging inside 5m by 5m by 5m block sizes. The mineral resource estimates were prepared in accordance with the Canadian Institute of Mining, Metallurgy and Petroleum (“CIM”) Definition Standards for Mineral Resources and Mineral Reserves, adopted by the CIM Standards, and the CIM Guidelines, using geostatistical and/or classical methods, plus economic and mining parameters appropriate to the deposit.
Non-IFRS Measures
The Company utilizes certain non-IFRS measures, including C1 cash cost of copper produced, which are not measures recognized under IFRS, as more particularly described in the Company’s management’s discussion and analysis for the three and six months ended June 30, 2019, a copy of which can be found on the Company’s website (www.erocopper.com) and on SEDAR (www.sedar.com). The Company believes that these measures, together with measures determined in accordance with IFRS, provide investors with an improved ability to evaluate the underlying performance of the Company. Non-IFRS measures do not have any standardized meaning prescribed under IFRS, and therefore they may not be comparable to similar measures employed by other companies. The data is intended to provide additional information and should not be considered in isolation or as a substitute for measures of performance prepared in accordance with IFRS.
C1 cash cost of copper produced (per lb) is the sum of production costs, net of capital expenditure development costs and by-product credits, divided by the copper pounds produced. C1 cash costs reported by the Company include treatment, refining charges, offsite costs, and certain tax credits relating to sales invoiced to the Company’s Brazilian customer on sales. By-product credits are calculated based on actual precious metal sales (net of treatment costs) during the period divided by the total pounds of copper produced during the period. C1 cash cost of copper produced per pound is a non-IFRS measure used by the Company to manage and evaluate operating performance of the Company’s operating mining unit and is widely reported in the mining industry as benchmarks for performance but does not have a standardized meaning and is disclosed in addition to IFRS measures.
QUALITY ASSURANCE / QUALITY CONTROL
Current QA/QC Program
The Company is currently drilling underground with core drill rigs using a combination of owned and third-party contracted drill rigs. During the period from August 2018 to September 2019, third party drill rigs were operated by Major Drilling, DrillGeo Geologia e Sondagem Ltda., and Layne Christensen Co., all of whom are independent of the Company. Drill core is logged, photographed and split in half using a diamond core saw at MCSA’s secure core logging and storage facilities. Half of the drill core is retained on site and the other half-core is used for analysis, with samples collected on one-meter sample intervals unless an interval crosses a geological contact. Reverse circulation cuttings are split at the drill rig using one-meter sample intervals. All sample preparation is performed in MCSA’s secure on-site laboratory. Total copper is determined using a nitric-hydrochloric acid digestion and Atomic Absorption Spectrometry (“AAS”) and/or Titration. Oxide copper values are determined using sulfuric acid digestion followed by AAS. All such sample results have been monitored through a QA/QC program that includes the insertion of certified standards, blanks, and pulp and reject duplicate samples. Regular check-assays are submitted to ALS Brasil LTDA’s facility located in Vespasiano, Minas Gerais, Brazil, at a rate of approximately 5%. ALS Brasil LTDA is independent of the Company.
Historic Database QA/QC Validation
Samples that were analyzed prior to the implementation of MCSA’s current QA/QC program in 2007 have been subjected to the same quality control tools used currently to allow for an evaluation of the accuracy and precision of the grades that were obtained. Based on the demonstrated quality associated with the current sampling procedures and the post-2007 performance of MCSA’s laboratory, which is evaluated through daily QA/QC campaigns, MCSA conducted a post mortem QA/QC analysis, with the aim of validating the samples that were analyzed before the QA/QC program was effectively implemented. The post-mortem QA/QC analysis involved re-analyzing a minimum of 10% of the total number of samples with no corresponding QA/QC data to validate the historic assays. Please refer to the 2018 Technical Report for additional information related the post-mortem QA/QC analysis.
Qualified Persons and the NI 43-101 Technical Report
Rubens Jose De Mendonça, MAusIMM, Chartered Professional – Mining and Sr. Porfirio Cabaleiro Rodriguez, MAIG, have reviewed and approved the scientific and technical information contained in this press release. Messrs. Mendonça and Rodriguez are each independent of the Company and are qualified persons as defined by NI 43-101.
The Company will file the associated NI 43-101 compliant report on SEDAR (www.sedar.com) and on the Company’s website (www.erocopper.com) within 45 days of this press release, which will serve as an update to the technical report entitled “2018 Updated Mineral Resources and Mineral Reserves Statements of Mineração Caraíba’s Vale do Curaçá Mineral Assets, Curaçá Valley”, dated October 17, 2018 with an effective date of August 1, 2018, prepared by Rubens Jose De Mendonça, MAusIMM, of Planminas – Projectos e Consultoria em Mineração Ltd. and Porfirio Cabaleiro Rodrigues, MAIG, Fábio Valério Cãmara Xavier, MAIG, and Bernardo Horta de Cerqueira Viana, MAIG, all of GE21, who are independent qualified persons under NI 43-101 (the “2018 Technical Report”).
ABOUT ERO COPPER CORP
Ero Copper Corp, headquartered in Vancouver, B.C., is focused on copper production growth from the Vale do Curaçá Property, located in Bahia, Brazil. The Company’s primary asset is a 99.6% interest in the Brazilian copper mining company, Mineraҫão Caraíba S.A. (“MCSA”), 100% owner of the Vale do Curaçá Property with over 40 years of operating history in the region. The Company currently mines copper ore from the Pilar and Vermelhos underground mines. In addition to the Vale do Curaçá Property, MCSA owns 100% of the Boa Esperanҫa development project, an IOCG-type copper project located in Pará, Brazil and the Company, directly and indirectly, owns 97.6% of the NX Gold Mine, an operating gold and silver mine located in Mato Grosso, Brazil. Additional information on the Company and its operations, including technical reports on the Vale do Curaçá, Boa Esperanҫa and NX Gold properties, can be found on the Company’s website (www.erocopper.com) and on SEDAR (www.sedar.com).
| ERO COPPER CORP. | |
| Signed: “David Strang” | For further information contact: |
| David Strang, President & CEO | Makko DeFilippo, Vice President, Corporate Development |
| (604) 429-9244 | |
| info@erocopper.com |
CAUTION REGARDING FORWARD LOOKING INFORMATION AND STATEMENTS This press release contains “forward-looking information” within the meaning of applicable Canadian securities laws. Forward-looking information includes statements that use forward-looking terminology such as “may”, “could”, “would”, “will”, “should”, “intend”, “target”, “plan”, “expect”, “budget”, “estimate”, “forecast”, “schedule”, “anticipate”, “believe”, “continue”, “potential”, “view” or the negative or grammatical variation thereof or other variations thereof or comparable terminology. Such forward-looking information includes, without limitation, statements with respect to the estimation of mineral reserves and mineral resources, updated production plan, updated operating and capital cost estimates including expected costs and timing of mill expansion capital, mine plan optimization efforts, potential benefits of ore sorting, the nature of any mineralization which has yet to be defined, mine life extension, and future exploration including specific target areas and expected ratio of regional greenfield drilling to total meters drilled.
Forward-looking information is not a guarantee of future performance and is based upon a number of estimates and assumptions of management in light of management’s experience and perception of trends, current conditions and expected developments, as well as other factors that management believes to be relevant and reasonable in the circumstances, as of the date of this press release including, without limitation, assumptions about: favourable equity and debt capital markets; the ability to raise any necessary additional capital on reasonable terms to advance the production, development and exploration of the Company’s properties and assets; future prices of copper and other metal prices; the timing and results of exploration and drilling programs; the accuracy of any mineral reserve and mineral resource estimates; the geology of the Vale do Curaçá Property being as described in the technical report for the property; production costs; the accuracy of budgeted exploration and development costs and expenditures; the price of other commodities such as fuel; future currency exchange rates and interest rates; operating conditions being favourable such that the Company is able to operate in a safe, efficient and effective manner; political and regulatory stability; the receipt of governmental, regulatory and third party approvals, licenses and permits on favourable terms; obtaining required renewals for existing approvals, licenses and permits on favourable terms; requirements under applicable laws; sustained labour stability; stability in financial and capital goods markets; availability of equipment; positive relations with local groups and the Company’s ability to meet its obligations under its agreements with such groups; and satisfying the terms and conditions of the Company’s current loan arrangements. While the Company considers these assumptions to be reasonable, the assumptions are inherently subject to significant business, social, economic, political, regulatory, competitive and other risks and uncertainties, contingencies and other factors that could cause actual actions, events, conditions, results, performance or achievements to be materially different from those projected in the forward-looking information. Many assumptions are based on factors and events that are not within the control of the Company and there is no assurance they will prove to be correct.
Furthermore, such forward-looking information involves a variety of known and unknown risks, uncertainties and other factors which may cause the actual plans, intentions, activities, results, performance or achievements of the Company to be materially different from any future plans, intentions, activities, results, performance or achievements expressed or implied by such forward-looking information. Such risks include, without limitation the risk factors listed under the heading “Risk Factors” in the Annual Information Form of the Company for the year ended December 31, 2018, dated March 14, 2019.
Although the Company has attempted to identify important factors that could cause actual actions, events, conditions, results, performance or achievements to differ materially from those described in forward-looking information, there may be other factors that cause actions, events, conditions, results, performance or achievements to differ from those anticipated, estimated or intended.
The Company cautions that the foregoing lists of important assumptions and factors are not exhaustive. Other events or circumstances could cause actual results to differ materially from those estimated or projected and expressed in, or implied by, the forward-looking information contained herein. There can be no assurance that forward-looking information will prove to be accurate, as actual results and future events could differ materially from those anticipated in such information. Accordingly, readers should not place undue reliance on forward-looking information.
Forward-looking information contained herein is made as of the date of this press release and the Company disclaims any obligation to update or revise any forward-looking information, whether as a result of new information, future events or results or otherwise, except as and to the extent required by applicable securities laws.
Cautionary Notes Regarding Mineral Resource and Reserve Estimates In accordance with applicable Canadian securities regulatory requirements, all mineral reserve and mineral resource estimates of the Company disclosed or incorporated by reference in this press release have been prepared in accordance with NI 43-101 and are classified in accordance with the CIM Standards.
Mineral resources which are not mineral reserves do not have demonstrated economic viability. Pursuant to the CIM Standards, mineral resources have a higher degree of uncertainty than mineral reserves as to their existence as well as their economic and legal feasibility. Inferred mineral resources, when compared with Measured or Indicated mineral resources, have the least certainty as to their existence, and it cannot be assumed that all or any part of an Inferred mineral resource will be upgraded to an Indicated or Measured mineral resource as a result of continued exploration. Pursuant to NI 43-101, Inferred mineral resources may not form the basis of any economic analysis. Accordingly, readers are cautioned not to assume that all or any part of a mineral resource exists, will ever be converted into a mineral reserve, or is or will ever be economically or legally mineable or recovered.